Climate Change and Natural Capital Initiatives
Climate Change and Natural Capital Initiatives
Our policies on Climate-Related and Nature-Related Issues
IRM clearly understands that climate change issues have significant impacts on the environment, economic activities, and our business activities. We are also fully aware that since our business activities impact and depend on natural capital (water, land, biodiversity, etc.), its health is essential for the sustainability of our corporate value and society. We believe that combating climate change and conserving natural capital are closely interrelated, requiring comprehensive approaches to both challenges. Going forward, we will continue contributing to sustainability by identifying, analyzing, and disclosing key climate-related and nature-related issues.
Integrated disclosure based on the TCFD and TNFD frameworks
To identify key climate-related and nature-related issues, IRM first endorsed the recommendations of the TCFD (Task Force on Climate-related Financial Disclosures) in March 2020 and has been assessing and disclosing climate-related risks and opportunities. Furthermore, in 2025, to deepen our analysis of nature-related issues, we expressed support for the TNFD (Taskforce on Nature-related Financial Disclosures) policies, and have been collecting information as a TNFD Forum member. Based on these initiatives, this report will disclose climate-related and nature-related issues based on the four pillars of the TCFD and TNFD disclosure frameworks: Governance, Strategy, Risk management, and Metrics and Targets.

Governance
Management’s roles and oversight by the Boards of Directors of IRM and each investment corporation
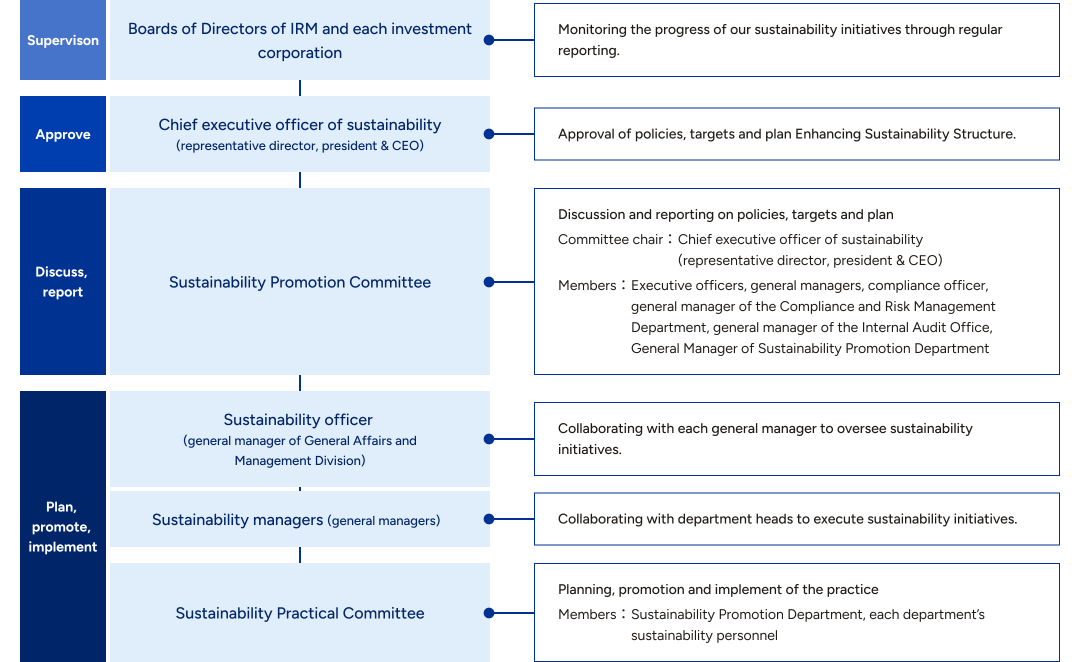
- IRM has established the Sustainability Promotion Committee, which is chaired by the representative director, and the Sustainability Practical Committee, which is composed of employees responsible for actual operations in each department.
- The Sustainability Promotion Committee meets at least twice a year to implement a PDCA cycle with the aim of improving asset value over the medium to long term. The PDCA cycle consists of the following steps: formulate sustainability goals and initiatives, identify and evaluate climate-related and nature-related risks and opportunities, analyze climate-related and nature-related risks and manage them company-wide, monitor environmental performance as well as the results of ESG evaluation by external organizations, verify the degree of achievement of goals, and reset goals for remaining and new challenges.
-
Climate-related and nature-related goals are set by the representative director, who is the chief executive officer of sustainability, and the progress made toward goals and on initiatives is reported to the Board of Directors of IRM and each investment corporation at least once a year. The Sustainability Practical Committee is responsible for promoting various measures needed to achieve these goals.
Risk Management
Risk identification and evaluation and integration with company-wide risk management
-
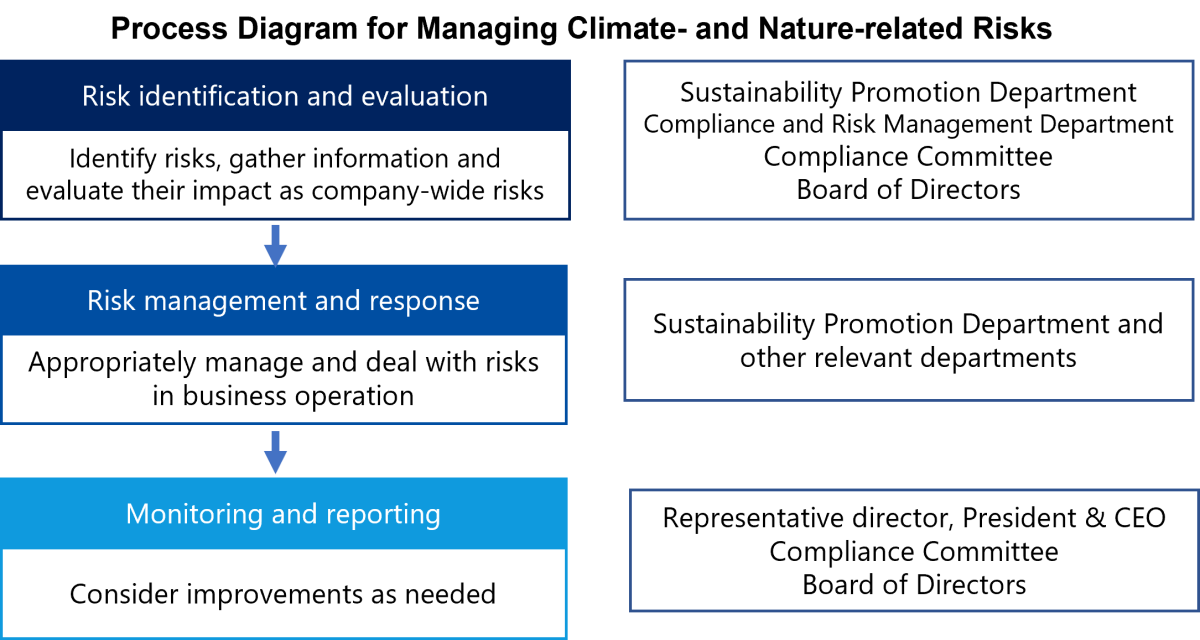
IRM has established the “Risk Management Regulations” and “Risk Management Standards” as internal regulations to clearly define fundamental risk management principles and internal control systems, aiming to contribute to the appropriate operation of business and ensure sound management. These regulations designate the President and Representative Director, who is the Chief Executive Officer (CEO), as the overall risk management officer; the heads of each department and office as the risk management officers for their respective departments; and the Compliance and Risk Management Office as the analysis and monitoring department.
-
IRM identifies climate-related and nature-related risks as having significant financial and strategic implications for its business and manages them by integrating them into its company-wide risk management process.
-
The Compliance and Risk Management Office conducts impact assessments as part of company-wide risk management by consolidating concerns and the status of control activities for each risk from executives and risk management officers. At the beginning of each fiscal year, the office identifies risks surrounding IRM. Following discussions involving management, including the President and Representative Director, it selects items requiring focused attention. It reports these items to the Compliance Committee and the Board of Directors, among others. Furthermore, as the fiscal year progresses, it monitors the status of control activities addressing these risks and similarly reports the results.
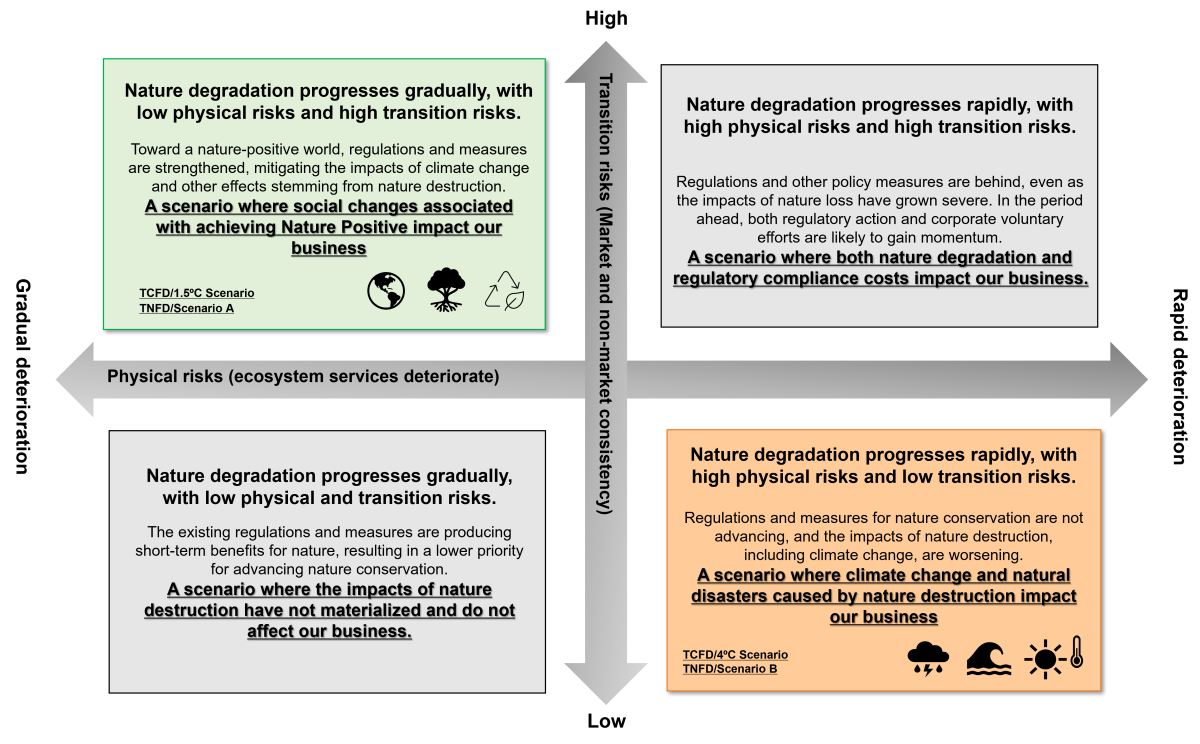
Climate-related and Nature-related issues: Scenario outline
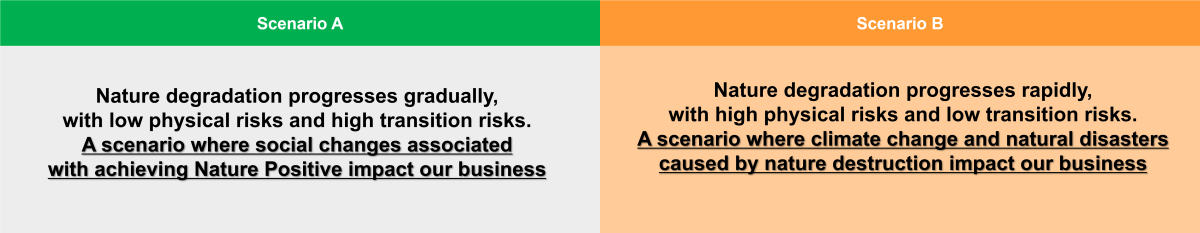
To identify climate- and nature-related issues, we first assessed how changes in climate and the natural environment could affect ADR’s business environment. To assess our resilience, we have adopted two extreme scenarios for ADR: one with maximum transition risks and the other with maximum physical risks. Specifically, in one of the scenarios, social changes associated with achieving Nature Positive impact our business, and in the other, climate change and natural disasters caused by nature destruction impact our business.
Please follow this link for details of the scenarios recommended by the TNFD.
For specific climate change scenarios, please see "Scenario Analysis"
Climate-related and Nature-related issues: List of risks and opportunities
Based on the overview of the scenarios developed using the TCFD and TNFD analysis frameworks, we have identified the following climate-related and nature-related risks and opportunities.
Please refer to the relevant sections for the details of each analysis and identification procedure, and the analysis results for each scenario.
- TCFD disclosure … Climate Change Initiatives
- TNFD disclosure … Natural Capital Initiatives
| Category | Factor | Impact (Risk/Opportunity) |
Climate change |
Natural capital |
|||
|---|---|---|---|---|---|---|---|
| 1.5℃ | 4℃ |
Scenario A |
Scenario B |
||||
| Transition risk |
Policies/ |
Relevant regulatory enhancement to control carbon emissions |
Operational costs increase due to carbon tax. |
〇 |
〇 |
〇 |
〇 |
|
Procurement costs for construction materials increase due to carbon tax. |
〇 |
〇 |
- | - | |||
|
Property acquisition costs increase due to higher construction costs associated with energy code compliance. |
〇 | 〇 | 〇 | 〇 | |||
|
Waste management |
Recycling costs increase due to social movements promoting reuse and recycling. |
- | - | 〇 | 〇 | ||
| Markets | Progress in climate-focused investments and financing | Fundraising costs increase due to delay in climate-proofing the company’s properties (not qualifying for reduced interest rates). | 〇 | - | - | - | |
| Changes in tenant demands (Growing needs for climate-proof properties ) |
Income from leasing business declines due to delay in climate-proofing properties. | 〇 | - | - | - | ||
| Physical risk |
Acute |
Intensified natural disasters and a higher risk of wind and flood hazards, including heavy rainfalls, typhoons, floods, landslides, ground instability, and high tides |
Intensifying natural disasters damage properties and result in a loss of business opportunities. |
〇 | 〇 | 〇 | 〇 |
|
Chronic |
Higher average temperatures and intensified natural disasters |
Energy costs rise due to a higher average temperature |
〇 | 〇 | 〇 | 〇 | |
|
Casualty insurance premiums rise as natural disasters intensify. |
〇 |
〇 |
〇 |
〇 |
|||
| Opportunities |
Resource optimization |
Stricter energy conservation regulations |
Cut operational costs to reduce energy consumption. |
〇 | 〇 | 〇 | 〇 |
|
Compliance with stricter water consumption regulations |
Enhance water efficiency of properties by deploying water-saving facilities (low-flow toilets and showers) actively and progressively to make properties appealing. |
- | - | 〇 | 〇 | ||
|
Waste management |
Continue waste sorting practices that maintain high recycling rates to help promote reuse and recycling for the entire society. |
- | - | 〇 | 〇 | ||
|
Markets |
Progress in climate-focused investments and financing |
Implement climate measures to lower fundraising costs and attract investment (qualify for reduced interest rates). |
〇 |
- |
- |
- |
|
|
Changes in tenant demands(Higher needs for climate-proof properties) |
Provide low-carbon facilities and services for tenants to increase rental income (high occupancy ratio, high rents). |
〇 |
- |
- |
- |
||
|
Products and services |
Control of hazardous substances from construction work |
Mitigate additional costs from stricter regulations by maintaining compliant construction practices, including proper hazardous material management. |
- |
- |
〇 | 〇 | |
*For each risk and opportunity, items that do not materialize under the given scenario are marked with “-”.
Climate Change Initiatives
Strategy
We classify various change factors in the external environment resulting from climate change into transition risks and physical risks and identify and evaluate them as risks and opportunities. We select any factors that have a material impact on our business and run scenario analysis. We mainly analyze and calculate transition risks related to “policies/regulations, markets, reputation,” and physical risks in the categories of “acute/chronical,” and opportunities related to “markets, energy sources, resource efficiency, products and services.” We aim to reduce our environmental impact while achieving a medium- and long-term growth by addressing climate change-related risks and enhancing our efforts to capture opportunities.
Scenario Analysis
The following chart shows the images of the world surrounding our investment corporations in the climate change scenarios with a 4-degree Celsius temperature rise and 1.5-degree Celsius temperature rise as the background for risk and opportunity identification and evaluation.
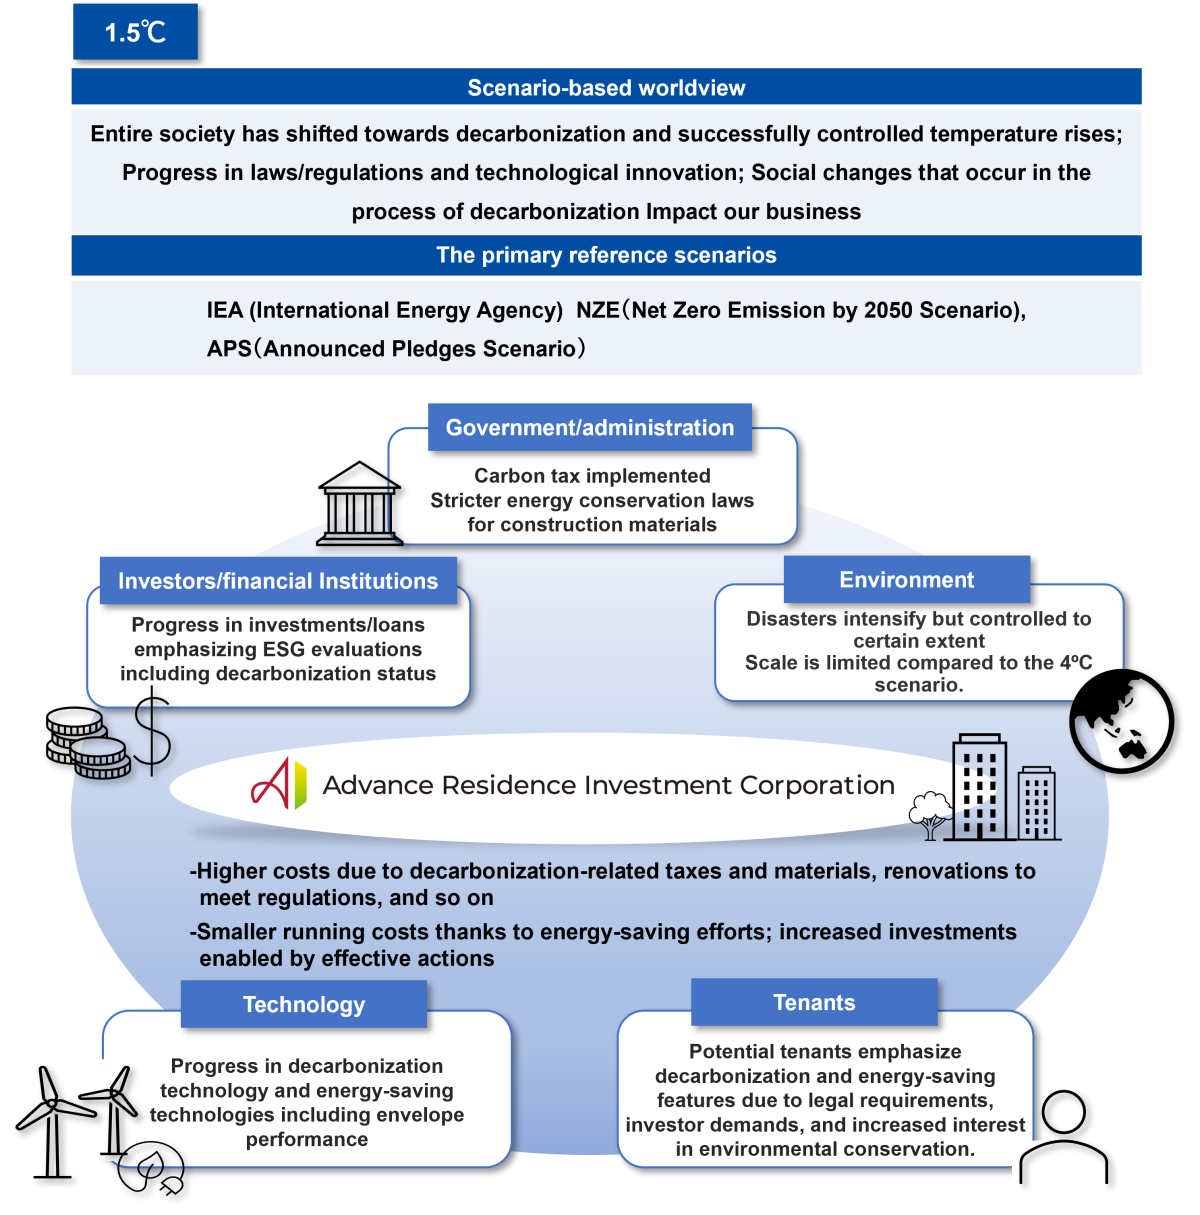
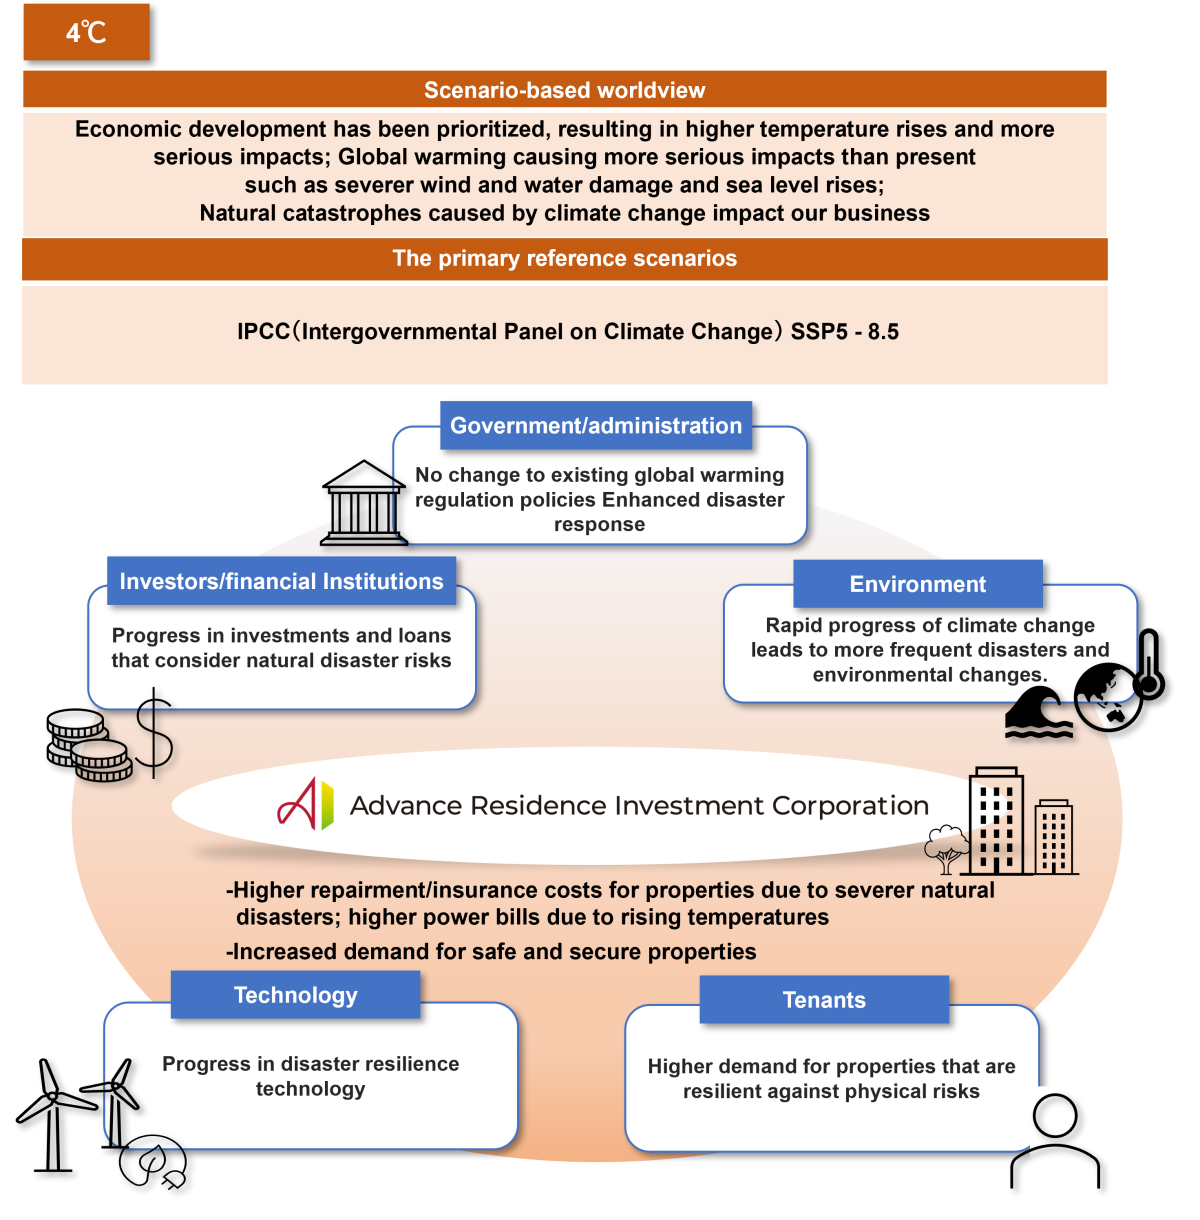
Risk and opportunity identification and impact analysis
The following table shows climate risks for ADR identified based on the 1.5ºC and 4ºC scenarios as well as their financial impacts, countermeasures, and business opportunities. We will disclose the “Metrics and Targets” for managing these risks and opportunities in an integrated manner with TNFD-based analysis
|
|
over ¥300M |
over ¥100M and under ¥300M |
under ¥100M |
|---|---|---|---|
|
Financial Impact |
High | Medium | Low |
| Category | Factor | Impact (Risk/Opportunity) |
Financial impact (millions of yen) |
Priority for action |
Countermeasures | |||
|---|---|---|---|---|---|---|---|---|
| 1.5℃ | 4℃ |
1.5℃ |
4℃ |
Overview | ||||
| Transition risk |
Policies/ |
Relevant regulatory enhancement to control carbon emissions |
Operational costs increase due to carbon tax. |
▲130 |
▲ 2 |
Medium |
Low |
|
|
Procurement costs for construction materials increase due to carbon tax. |
▲160 |
▲2 |
Medium |
Low |
|
|||
|
Property acquisition costs increase due to higher construction costs for energy code compliance. |
▲10 | ▲10 | Low | Low |
|
|||
| Markets |
Progress in climate-focused investments and financing |
Fundraising costs increase due to delay in climate-proofing the company’s properties (not qualifying for reduced interest rates). |
▲239 |
- | Medium | - |
|
|
|
Changes in tenant demands |
Income from leasing business declines due to delay in climate-proofing properties. |
▲1,096 |
- |
High |
- |
|
||
| Physical risk |
Acute |
Intensified natural disasters and a higher risk of wind and flood hazards, including heavy rainfalls, typhoons, floods, and high tides |
Intensifying natural disasters damage properties and result in a loss of business opportunities. |
▲232 |
▲465 |
Medium |
High |
|
|
Chronic |
Higher average temperatures and intensified natural disasters |
Energy costs rise due to a higher average temperature. |
▲ 4 |
▲10 |
Low |
Low |
|
|
|
Casualty insurance premiums rise as natural disasters intensify. |
▲6 |
▲13 |
Low |
Low |
|
|||
| Opportunities |
Resource efficiency |
Stricter energy conservation regulations |
Cut operational costs to reduce energy consumption |
11 |
11 |
|||
|
Markets |
Changes in tenant demands(Higher needs for climate-proof properties) |
Provide low-carbon facilities and services for tenants to increase rental income (high occupancy ratio, high rents). |
239 |
- | ||||
|
Progress in climate-focused investments and financing |
Implement climate measures to lower fundraising costs and attract investment (qualify for reduced interest rates). |
1,096 |
- | |||||
(Note)
-Costs are marked with ▲.
-Of the risks and opportunities, items that do not materialize under the relevant scenario are marked with “-”.
-For risks envisaged under the 1.5°C and 4°C scenarios, we indicate the priority for action as “high,” “medium,” or “low,” taking into account the expected timing of occurrence and the business impact.
-The figures stated as financial impact represent the annual monetary impact. An analysis was conducted on the risks and opportunities of climate change factors that are deemed to have a particularly material impact on ADR’s business activities.
-Furthermore, the above estimates were calculated based on ADR’s past investment performance, scenarios presented by international organizations and others, and data released by relevant government agencies or other third parties. ADR therefore does not guarantee the accuracy of these figures. The countermeasures listed are also presented for the purpose of calculating the impact; no plan or decision has been made for their implementation.
Natural Capital Initiatives
TNFD recommendations: General requirements
The following are the six general requirements from the TNFD recommendations, or basic principles and requirements for all organizations conducting disclosure based on them.
|
General requirements |
Measures implemented |
|---|---|
|
Application of materiality |
Based on objective information from external tools regarding the business activities listed below, we identified the dependency and impact factors, risks, and opportunities for ADR as described in “The TNFD Analysis Process.” Considering both the impact of nature on ADR's business and the impact of ADR's business on nature from a double materiality perspective, we identified material nature-related issues based on their significance, frequency of occurrence, and likelihood of occurrence. |
|
Scope of disclosure (Business activities subject to analysis) |
Direct operations : real estate investment, building completion Upstream value chain : building construction Proceed to STEP 1 for details |
|
Location of nature-related issues |
Since this analysis was conducted for all properties, we did not specify priority regions or properties. Proceed to STEP 3 for details |
|
Integration with other sustainability-related disclosures |
For shared elements with the TCFD analysis and disclosure framework, we have integrated our disclosure. |
|
Timeline |
The analysis is conducted under 2030 scenarios assuming changes in nature. |
|
Engaging stakeholders |
ADR understands how our business activities impact the environment and society and commits to a sustainable society by fulfilling our corporate responsibilities. To that end, we have implemented initiatives to serve tenants and local communities as set forth in our Sustainability Policy. We also clarify our human rights guidelines by disseminating our Sustainability Procurement Policy and Sustainability Procurement Guideline, including prohibition of forced labor and child labor. We also conduct regular surveys to monitor compliance, promoting relevant initiatives throughout the supply chain |
TNFD analysis process
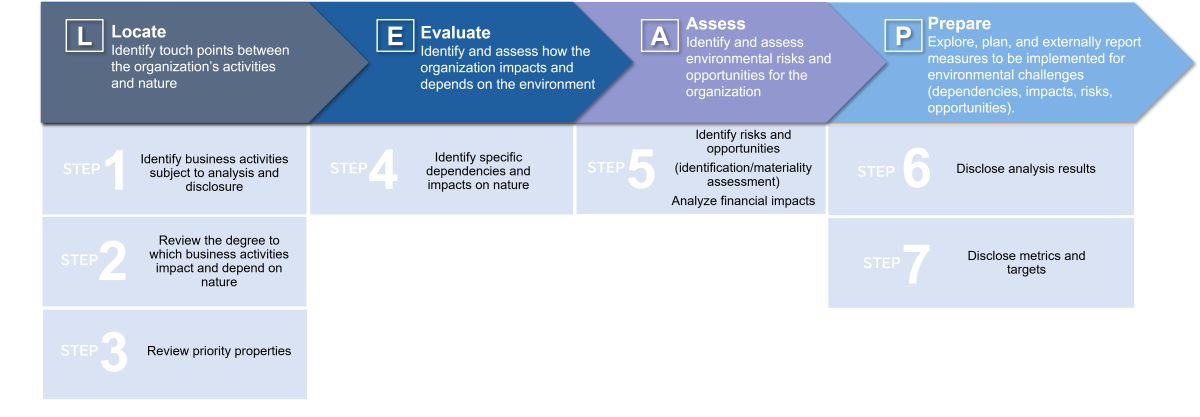
For TNFD analysis, we used the LEAP approach. It is a systematic procedure involving identifying the value chain, touch points with nature, and priority regions (Locate); evaluating the dependencies and impacts on nature in those points (Evaluate); identifying and assessing resulting risks and opportunities (Assess); and managing them and disclosing related findings (Prepare).
STEP1:Identify business activities subject to analysis and disclosure
ADR has identified the following target value chain components for this TNFD analysis and disclosure. We understand these are just a handful of business activities in the value chain, which actually contains many more, including tenants’ actions downstream. However, to clarify natural capital challenges that ADR should prioritize, we have shortlisted those that are highly relevant and impactful for our business activities.
|
Value chain phase |
Major category |
Business activity |
|---|---|---|
|
Direct operation |
Real estate |
Real estate investment *1 |
|
Construction |
Building completion *1, 2 |
|
|
Upstream |
Construction |
Building construction |
*1 We classified our business activities using the International Standard Industrial Classification of All Economic Activities (ISIC). Under the ISIC, real estate investment is defined as “Real estate activities with own or leased property” and building completion is defined as “Building completion and finishing.”
*2 This refers to tenant space restoration work, which is included in waste data aggregation for ADR’s environmental performance management.
STEP2:Identify the level of dependency and impact in the value chain
To identify natural capital risks and opportunities, we first analyzed the degree to which the target business activities shortlisted in STEP 1 impact and depend on natural capital. For this analysis, we used ENCORE. The results are shown in the heatmap below.
Real estate investment and building completion : Even if ecosystem services deteriorate, the direct impact on these operations will be limited. Meanwhile, the analysis showed that these activities are closely related to various types of natural capital, including water, soil, and air.
We have identified some relationship with risks of natural disasters, including storms and floods (Impact level: L and M)
Building construction : The analysis showed that building construction has significant impacts on nature, including water pollution, soil pollution and construction noise.
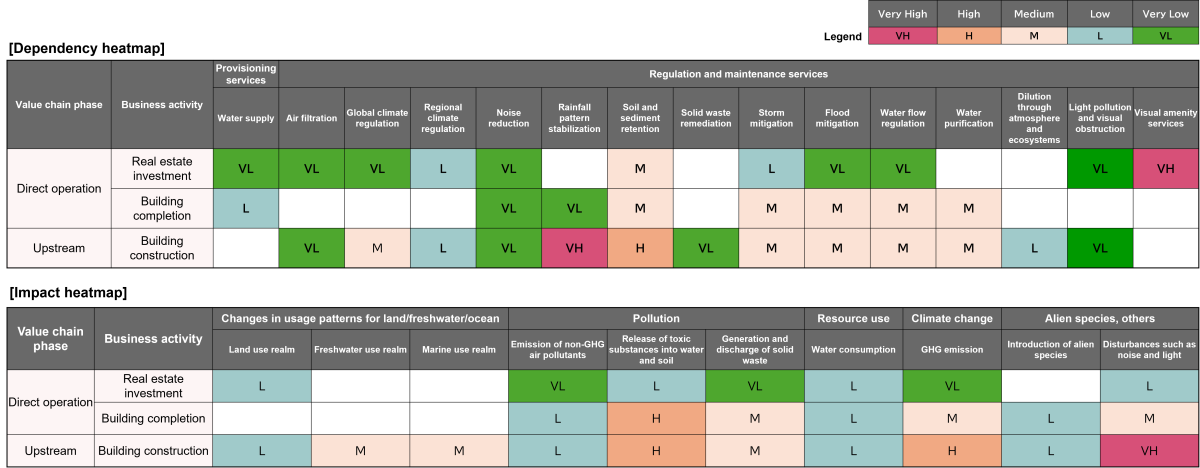
*ENCORE: A digital tool co-developed by Global Canopy, the UNEP Finance Initiative: Innovating Financing for Sustainability (UNEP‐FI), and the UN Environment Programme World Conservation Monitoring Centre (UNEP-WCMC). This tool is used to assess and disclose the degree to which each type of economic activity as classified under the ISIC impacts and depends on natural capital on a five-level scale, with VL indicating the lowest degree and VH the highest. (Website: https://encorenature.org/en)
STEP3:Identify the level of dependence and impact by property
In STEP 2, we identified the dependencies and impacts that may concern our general business activities. In STEP 3, we analyzed the degree to which all the properties impact and depend on natural capital to identify the areas and properties that we should prioritize. For this analysis, we used the environmental performance data for each property and an external tool called “WWF Risk Filter” *1.
The analysis showed that the flood risk may increase by 2030, but such trends were not significant for any property or area. The findings were mostly consistent with Japan’s overall trends - there were no areas or properties where the risk of natural disasters was considerably high or our business activities had a critical impact on nature.
Therefore, in analyzing the risks and opportunities, we targeted all the properties because we were aware of potential risks and opportunities, including higher water risks due to climate change, future legal amendments, and supply chain impacts on biodiversity.
Assessment items : environmental performance data (energy, water, waste, GHG Scopes 1 and 2, and category 13 of Scope 3), environmental certification status, greenery area, and ecosystem conditions (assessed using the WWF Risk Filter)
[Excerpt from analysis results (identified properties rated high in the comprehensive environmental impact assessment*2 based on environmental performance)]
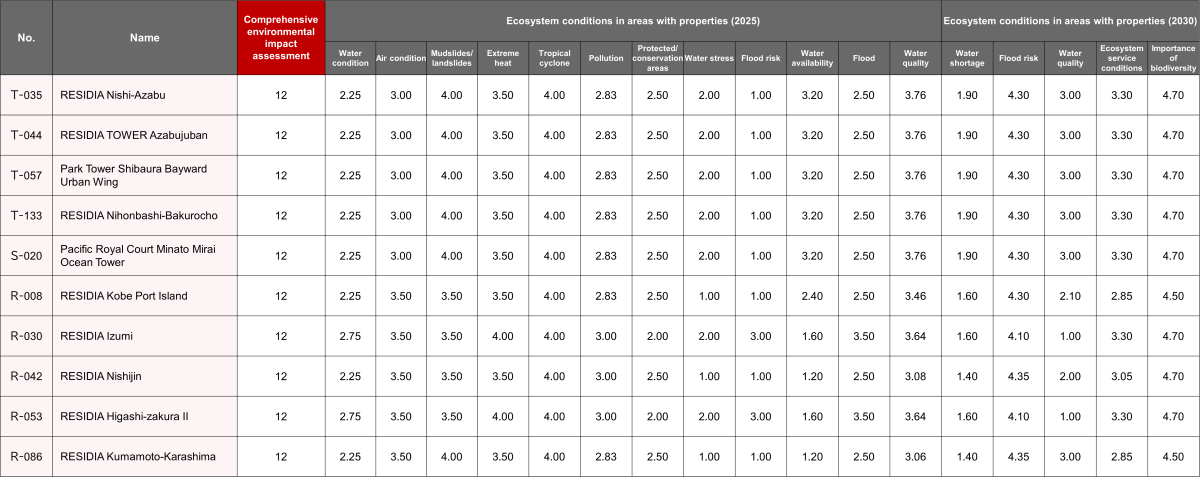
*1 The WWF Risk Filter is a tool provided by the World Wide Fund for Nature (WWF) used by companies and financial institutions to assess environmental risks (particularly, biodiversity risks) and water risks and analyze various scenarios. The risk rating scale varies by target periods when the level of dependency and impact are measured. In screening for current risks, a five-level scale ranging from 1 to 5 applies, with 4.2 or higher ratings representing extremely high risks. Meanwhile, future risk screening for 2030 uses a six-level scale ranging from 1 to 6.
*2 The comprehensive environmental impact assessment covers the following four items for each property: water consumption, waste output, total emissions from Scopes 1 and 2, and emissions from category 13 of Scope 3. Each is rated on a scale of 3 points, with a maximum total score of 12. The items were rated as follows based on the performance. All the properties were assessed on the applicable items (consumption or emissions), with the top 20% rated as 3 points and the bottom 20% as 1 point. The remaining middle of 60% was rated as 2 points.
STEP4:Identify dependencies and impacts
To clarify things to consider in identifying risks and opportunities, we explored dependencies and impacts that may concern our general business activities. Specifically, we assessed each stage of our direct operations - real estate investment and building completion - and the upstream building construction sector.
Examples:
・Visual amenity services : In the heatmap created in STEP 2, this item was rated as “VH” (very high) because the appeal of properties depends on surrounding landscapes. However, we excluded this item from our risk/opportunity analysis. This is because many of our residential properties are conveniently located in city centers and near facilities like stations, and our target tenant demographics are unlikely to emphasize landscapes in selecting properties.
・Control of hazardous substances : We included this item in our risk/opportunity analysis. One reason is because although the item was rated as “L” (low) in the heatmap, we identified some relevance for our business activities. Restoration work is essential for our operations, and controlling the release of hazardous substances from construction materials and paint helps to prevent environmental pollution. In addition, delays in such initiatives may result in higher operational costs due to regulatory enhancement in the future.
STEP5:Identify risks and opportunities (identification/materiality assessment)
Based on the dependencies and impacts identified as possibly relevant to business activities in STEP 4, we have thoroughly identified potential risks and opportunities for ADR. We considered the potential impacts on our direct operations, i.e., real estate investment and building completion, as well as construction in the upstream value chain.
- Identifying risks and opportunities
Risks and opportunities in direct operations (real estate investment and building completion) : We have identified how our daily investment activities affect natural capital, including water resource consumption, energy consumption, waste outputs, land use, and impacts on biodiversity. We have also itemized consequences such as increases in management costs and legal and regulatory risks. We also explored opportunities arising from measures to mitigate environmental impacts, including deploying energy conservation facilities, using renewable energies, and promoting greening initiatives.
Risks and opportunities in the upstream value chain (construction) : As indicated in STEP 2, construction work is believed to have significant impacts on natural capital, including those of material procurement, pollution from construction work, restrictions on land use, and effects on biodiversity. However, in identifying such risks and opportunities, we struggled to trace impacts on nature from construction work to ADR’s activities. Therefore, instead of exhaustively assessing risks and opportunities from the upstream construction process, we shortlisted risks that may emerge from our real estate investment activities.
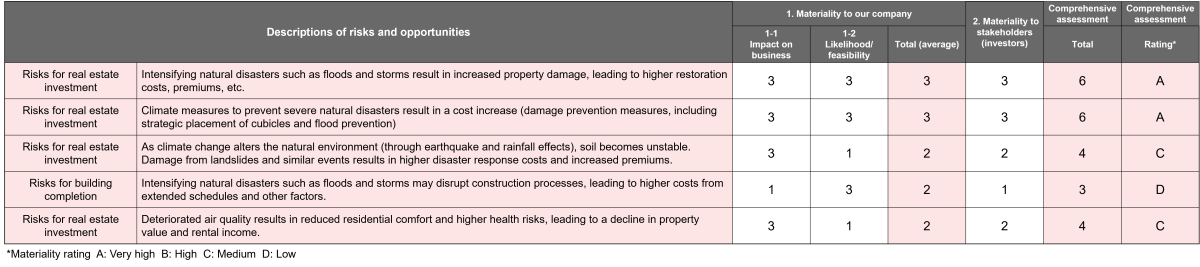
[Workflow for identifying risks and opportunities (excerpt from the list) )
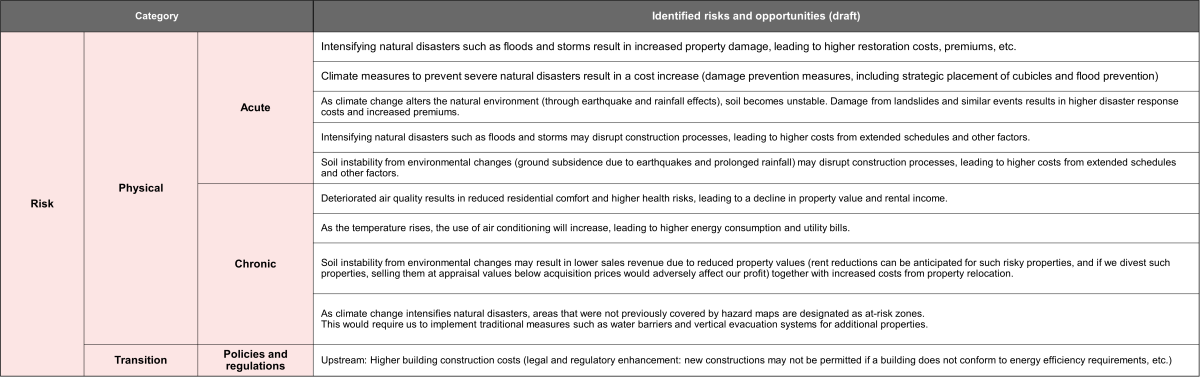
- Rating for materiality assessment
We rated the materiality of identified risks and opportunities based on their likelihood and the degree to which they might affect our business. In conducting the analysis, we found many commonalities and interrelated aspects between nature-related risks and opportunities and climate risks and opportunities. Therefore, we exhaustively analyzed nature-related risks and opportunities while ensuring consistency with the existing TCFD analysis.
STEP6:Disclose analysis results
We qualitatively assessed the financial impacts of individual risks and opportunities based on the two projection models from the “Climate-related and Nature-related issues : Scenario outline” section: Scenario A (gradual nature deterioration) and Scenario B (rapid degradation of nature).
In Scenario A, transition risks due to carbon tax and other regulatory enhancements for nature conservation became apparent. Meanwhile, Scenario B indicated that increasing physical risks - property damage and loss of rental income opportunities - from natural disasters, including heavy rainfalls, floods, and ground instability, would pose significant challenges. In addition, both scenarios revealed that stricter waste and water regulations would lead to risks and opportunities for our business activities. To address them, we will establish metrics and targets and continue monitoring progress and improving.
|
|
over ¥300M |
over ¥100M and under ¥300M |
under ¥100M |
|---|---|---|---|
|
Financial Impact |
High | Medium | Low |
| Category | Factor | Impact (Risk/Opportunity) |
Scenario A |
Scenario B |
Countermeasures | |
|---|---|---|---|---|---|---|
|
Financial Impact |
Overview | |||||
| Transition risk |
Policies/ |
Relevant regulatory enhancement to control carbon emissions |
Operational costs increase due to carbon tax. |
Medium |
Low |
|
|
Property acquisition costs increase due to higher construction costs for energy code compliance. |
Low |
Low |
|
|||
|
Waste management |
Recycling costs increase due to social movements promoting reuse and recycling. |
- | - |
|
||
| Physical risk |
Acute |
Intensified natural disasters and a higher risk of wind and flood hazards, including heavy rainfalls, typhoons, floods, and high tides |
Intensifying natural disasters damage properties and result in a loss of business opportunities. |
Medium |
High |
|
|
Chronic |
Higher average temperatures and intensified natural disasters |
Energy costs rise due to a higher average temperature. |
Low |
Low |
|
|
|
Casualty insurance premiums rise as natural disasters intensify. |
Low |
Low |
|
|||
| Opportunities |
Resource efficiency |
Stricter energy conservation regulations |
Cut operational costs to reduce energy consumption |
Low |
Low |
|
|
Compliance with stricter water consumption regulations |
Enhance water efficiency of properties by deploying water-saving facilities (low-flow toilets and showers) actively and progressively to make the properties appealing. |
Not measurable | Not measurable | |||
|
Waste management |
Continue waste sorting practices that maintain high recycling rates to help promote reuse and recycling for the entire society. |
Not measurable | Not measurable | |||
|
Products and services |
Control of hazardous substances from construction work |
Mitigate additional costs from stricter regulations by maintaining compliant construction practices, including proper hazardous materials management. |
Not measurable |
Not measurable |
||
(Note)
-For items marked “-” , although they have been identified as risks, we have already implemented countermeasures and determined that no future financial impact will arise.
-For items marked “Not measurable,” although we identified them as qualitative opportunities, we decided not to quantify them due to the absence of supporting parameters and other factors.
-The above estimates were calculated based on ADR’s past investment performance, scenarios presented by international organizations and others, and data released by relevant government agencies or other third parties. ADR therefore does not guarantee the accuracy of these figures. The countermeasures listed are also presented for the purpose of calculating the impact; no plan or decision has been made for their implementation.
-While we have considered the characteristics of each scenario and consulted with third-party organizations and other entities, we do not guarantee the accuracy, completeness, or comprehensiveness of this analysis.
Metrics and Targets, Results
STEP7:Disclose metrics and targets
| Energy consumption | 20% reduction (intensity) by FY2030 (vs. FY2018) |
|---|---|
| CO2 emissions (GHG Scope1,2) | 51% reduction (total) by FY2030 (vs. FY2018) Net zero by FY2050 |
| Water consumption |
Do not increase intensity (common areas) by FY2030 to date (vs. FY2018) |
| Waste | Recycling rate 65% (Monitor leased space restoration work where the waste output can be tracked) |
| Acquisition of environmental and energy-saving certifications | Proportion of environmental and energy-saving certifications acquired by FY2030 30% or more (by total floor space) |